
Have you ever thought about how to display the report in a better way?
If you are new or a seasoned official, you will agree that it all comes down to setting up measurement tools, cleaning and processing the data, turning it into relevant information, analyzing it, and extracting insights. Indeed, it is hard work, but you are not done with it until you can effectively communicate it to your audience. Ideally, you will want your data to form a straight line from KPIs to influencing the business decision.
If you have prior experience working with web analytics, you will agree that digital marketing services have its painstaking routine to build tables and graphs in a spreadsheet. Once you have a decent dashboard, you can try to automate it or rely on other tools.
Google Studio comes with the promise of rendering greater depth inclusive of easy integrations for common data sources. However, you need to remember that tools offer potential and not a solution. This writing aims to highlight several ways of using Google Data Studio to present a report.
Ways to Showcase Reports with Google Data Studio
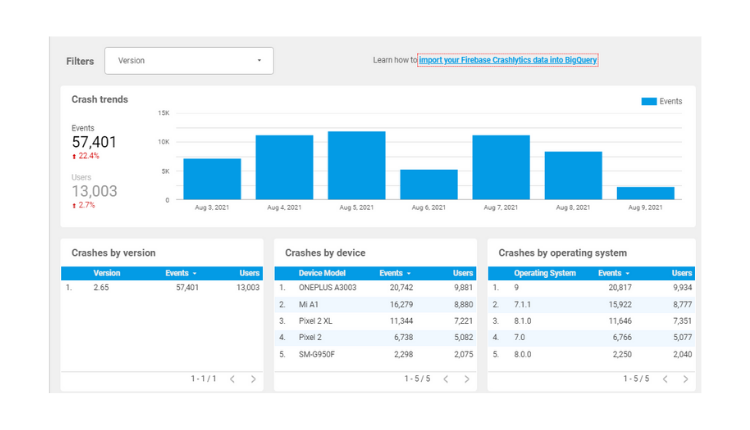
1. Building a funnel table having the bar feature
It is an easy and quick way to present how campaigns (e.g., channels and contents) are performing. In Google Studio, it is possible to events and page views are categorized based on the funnel; they target sourcing data on the right shows the pages and channels, which will win the most users on sequences each part.
2. Customizing the dimension in Google Data Studio
It is possible to treat data in the same way that you would in a spreadsheet. Moreover, you can manipulate your data to make your work clearer and easier. You can use CASE functions and conditional logic for the creation of new metrics and dimensions.
It is possible to create dimensions based on exclusive data groups.
3. Creation of calculated metric in Google Data Studio
In Google studio, you can deal effectively with a single step having multiple objectives. You may want to add them to the creation of total conversion for that phase. For instance, if a site is focused n obtaining leads, then the main goal can be achieved when a potential customer makes contact through email, phone call, or a form fill; it turns out to be the same macro goal measured in three ways. When it comes down to calculating the collective goal of leads, you can add them. However, you can do that if the goals are mutually exclusive. It makes sense to assume that the user will contact only once per session, and therefore it works.
4. Consolidating source data
In Google Analytics, it is possible to register different Facebook sources based on the device or if the visits are coming from a website or app. However, this level of granularity is not always required. When it comes down to measuring progress towards web or business objectives, it makes sense to aggregate them into a single source.
5. Mix and match data Sources
One of the main benefits of Google Data Studio is the ability to show data from different sources in a single visualization. It is possible to highlight data from Google Analytics and Google search console, Instagram, Facebook, Google Ads, YouTube, CRM, and Google Sheets and other data from the eCommerce platform.
A helpful context can be added right from a simple chart supporting data source. For instance, it is possible to layer data from Google search console data into an SEO report. Further, it will help you corroborate analytical data, uncover seasonal trends, and display achievements that are yet to materialize as traffic.
There is no single visualization tool that can help you rescue bad results on its own or make obvious a business decision. Using the right tools can help, although every new tool comes with a learning curve.
You must be aware of the fact that elements like the CASE function can help you save time and deliver better insights in the report that you have build. Once you understand the problems associated with traditional reporting, then Google Data Studio can help you overcome those problems. On your part, you need to have the motivation to learn every detail and start creating more informative and professional reports.
Also Read: Importance of Knowledge Panel in SEO
Also Read: Google Analytics Matrix You Need to Monitor Monthly